


About the Community Heat Resilience Tool
About the Community Heat Resilience Tool
The Community Heat Resilience Tool is a decision support platform designed to help communities understand health risks associated with extreme heat and to help them choose proven, effective, appropriate strategies for keeping people healthy, productive, and safe in the heat. CHaRT does this by providing location-specific risk assessment and intervention recommendations and guidance on how to use this information for community-engaged heat planning. Below we outline how heat affects health, how CHaRT combines heat-health risk assessment and intervention planning, and the modeling approach the platform uses. This background is enough to get started using the platform; there is a lot of additional guidance and documentation available as you engage further.
Heat puts health at risk
Heat is responsible for thousands of excess deaths per year in the United States.

Heat-related mortality was declining in the US, but in recent years, as extreme heat has become more widespread and intense, this trend has started to change for some populations and in some regions. There are increasing rates of heat-related calls to emergency medical services, emergency department visits, and persistently high levels of heat-related deaths.
Many factors affect risk for heat-related illness and death. Risk is highest for infants, elders, pregnant women, the poor, and outdoor workers, and for people with renal, respiratory, and psychiatric diseases. Systematic reviews have identified a wide range of other environmental factors that also drive risk, from sociodemographic factors to economic conditions to built environment characteristics. Risks, and the most appropriate risk reductions strategies, vary considerably by context.
Understanding and addressing heat-health risks
Most heat-related illness and death is preventable.
Effective prevention starts with understanding of a community’s risk, including its drivers and distribution.
The process continues with application of that understanding to choices about the most appropriate interventions for reducing the community’s risk.
This tool helps communities make informed decisions to reduce heat-health risks by linking location-specific risk assessment with evidence-based guidance on risk reduction interventions.

Framework for understanding risk
This platform uses a risk framework developed to better understand the health risks associated with extreme heat exposure. In this framework, risk is defined as the combination of historical extreme temperatures in a given location, population acclimatization to heat, environmental factors that amplify or reduce extreme heat, and social, demographic, economic, and health factors affecting population vulnerability. These factors have all been identified in epidemiological studies as driving the relationship between heat exposure and health effects.
This platform pulls together information on these factors and combines them using a multi-level modeling approach. The platform combines data on risk with models that recommend protective interventions to support decision making.
Framework for choosing risk reduction strategies
Reducing risk involves choosing and implementing interventions that reduce hazard intensity, population vulnerability, and exposure.
We identified interventions to consider by reviewing recent literature. For each intervention, we then assessed effectiveness using a standardized framework well known in public health and examined factors associated with the intervention’s implementation, its amenity value, and its cost, all of which have been identified as important considerations in scaling of public health interventions.
Using fuzzy logic, standardized scores for these factors are combined with local risk assessment to generate place-specific intervention recommendations.

Community-engaged risk reduction
Community engagement is central to risk assessment, risk management planning, and implementation of interventions.

Health action planning and implementation is more successful if communities are engaged throughout the process.
The outputs from the Community Heat Resilience Tool are meant to support community engagement, serving as a starting point for conversations about areas of the community that are at higher risk and why, as well as what interventions are recommended and what to expect if they are implemented.
See the Community engagement page for more information.
Fuzzy logic modeling
Fuzzy modeling is a tool for combining logical propositions using a hierarchical structure and approximations that mimic human understanding and experience. For example, a proposition such as "Where is heat most dangerous" can be evaluated using a combination of other logical propositions, such as "Where is temperature the hottest?" and "Where is tree cover lowest?" and "Where is outdoor work more common?"
Fuzzy modeling starts with causal diagrams, which are used to articulate logical propositions regarding the relationships between various characteristics in the system.
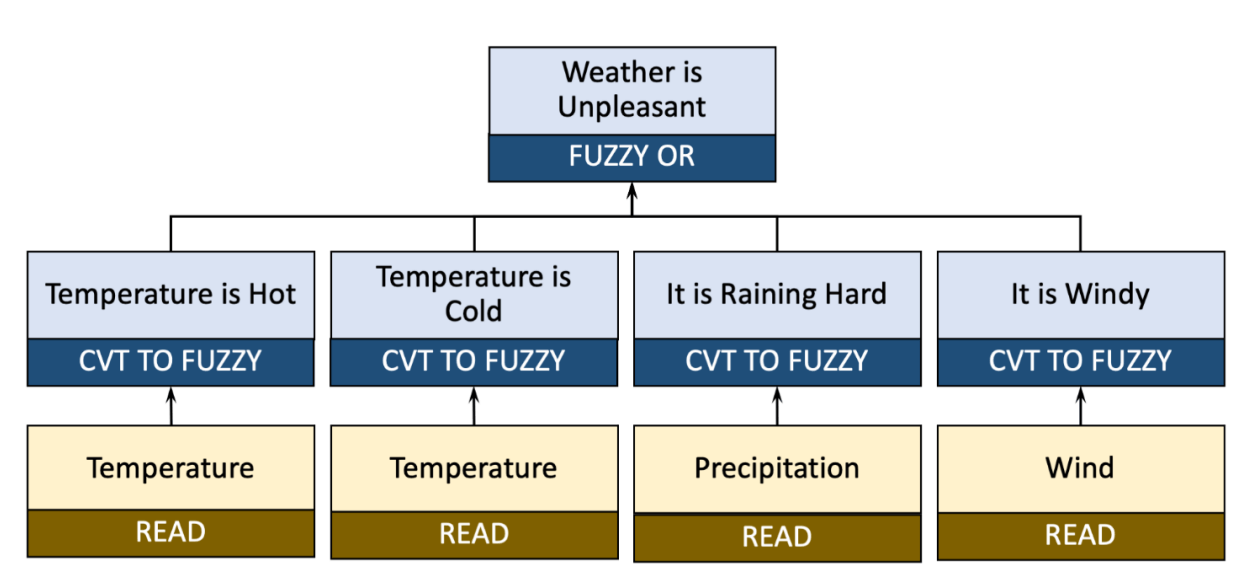
Fuzzy modeling involves transforming each characteristic in the model from its absolute value range, such as raw population count, to its fuzzy value range, such as Falsest to Truest for the proposition "tree cover is low." Propositions regarding relationships between characteristics are then combined within a model to get to progressively higher-order propositions and eventually contribute toward overall scores, for example, "more trees are recommended."
Learn more about fuzzy modeling.
How to use the tool
Learn how to use the Community Heat Resilience Tool on the How to use the tool page.